
 +86-0755-86131192
 2025-08-12
A Detailed Explanation of the Scientific Principles of the Plantar Pressure Distribution System
In daily human activities such as walking, running, and standing, the foot plays a crucial role in bearing the body's weight, absorbing shock, and transmitting movement forces.
It's more than just a "walking tool"; it's an essential link in the overall mechanical chain. The plantar pressure distribution system is used to accurately measure, analyze, and record the forces acting on the plantar surface during different motion states, providing scientific data support for sports medicine, rehabilitation therapy, footwear design, and ergonomic research.
To fully understand the principles of the plantar pressure distribution system, we must begin with three core aspects: mechanical foundations, sensor measurement technology, and data processing and analysis methods.
1. The Mechanical Basis of Plantar Force
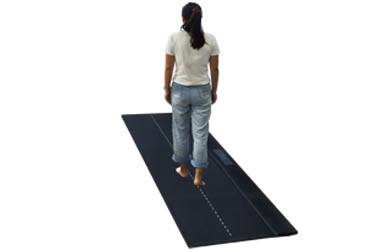
When humans walk, the foot does not contact the ground evenly, but rather provides support and propulsion according to a specific timing and mechanical pattern. Taking a normal gait as an example, plantar pressure distribution goes through the following process:
Heel Strike
Most people begin walking with heel strike. At this moment, the body's center of gravity has not yet fully shifted to the supporting foot, and the heel bears the highest vertical impact force, which can reach 1.2 to 1.5 times body weight.
Midstance
As the body's center of gravity shifts directly over the supporting foot, pressure begins to be evenly distributed across the arch and forefoot, maximizing the force-bearing area of the plantar surface and achieving maximum overall stability.
Push-Off
The toes (especially the first and second metatarsal heads and the big toe) are responsible for pushing the body forward. During this time, pressure in the forefoot increases significantly, with the metatarsal area bearing the greatest load, reaching over twice body weight.
During high-impact activities such as running and jumping, the plantar force pattern changes, with higher peak pressures and shorter durations, placing greater demands on the muscles, ligaments, and bones of the foot.
II. Core Hardware Principles of the Plantar Pressure Distribution System
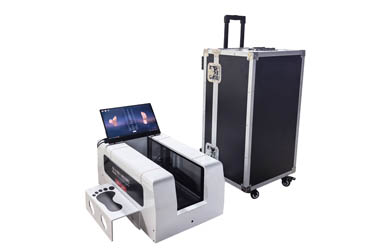
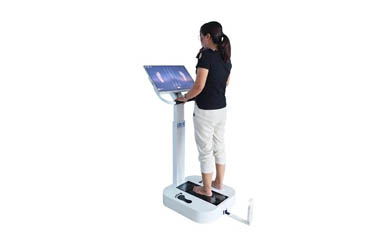
The core hardware of a plantar pressure distribution system is the pressure sensor array, typically composed of multiple highly sensitive miniature pressure sensors evenly distributed on the measurement platform or inside the insole. Commonly used sensing technologies include the following:
1. Resistive Pressure Sensor
When a sensor element is subjected to force, the resistance of its internal conductive material (such as carbon film or conductive rubber) changes. The system calculates the pressure applied at that point by measuring this change in resistance. Advantages include low cost, simple structure, and fast response speed; disadvantages include drift over long-term use and relatively limited accuracy.
2. Capacitive Pressure Sensor
This sensor contains two parallel conductive plates sandwiched between an elastic medium. When force is applied, the distance between the plates decreases, causing a change in capacitance. The system then measures this capacitance change to calculate pressure. Advantages include high sensitivity, good linearity, and durability; disadvantages include high manufacturing cost and high requirements for circuit anti-interference.
3. Piezoelectric Sensor
This sensor converts pressure into an electrical signal by utilizing the property of piezoelectric materials to generate an electric charge when subjected to force. This technology reacts extremely quickly and is suitable for capturing instantaneous impact (such as the moment of landing during running or jumping). However, long-term static measurements suffer from signal attenuation, making it unsuitable for static pressure monitoring.
4. Fiber Optic Sensing Technology
This technology infers pressure by detecting changes in light intensity or refractive index when an optical fiber is subjected to pressure. This technology has strong anti-interference capabilities and is suitable for measurement in harsh environments. However, it is bulky and expensive, and is currently primarily used in scientific research equipment.
Regardless of the technology, the core idea is to convert pressure into a measurable physical quantity (resistance, capacitance, voltage, optical signal, etc.), which is then converted into a digital signal by a signal acquisition module and fed into a data processing system.
III. Signal Acquisition and Processing
After the hardware acquires the pressure signal, the system converts the analog signal into a digital signal using an analog-to-digital converter (ADC). This step requires a high sampling rate and high resolution to capture subtle changes in plantar pressure.
For example, in running analysis, the contact time between the sole of the foot and the ground may be only about 200 milliseconds. If the sampling frequency is lower than 100 Hz, critical information may be missed. Professional systems typically set the sampling rate between 200 and 1000 Hz to ensure that every detail of the movement is fully recorded.
After the digital signal enters the processing unit (usually a computer or embedded processor), it undergoes the following steps:
Signal Filtering and Denoising
Pleat pressure sensors are susceptible to noise such as electromagnetic interference and mechanical vibration. Low-pass filtering and Kalman filtering are required to remove invalid signals.
Calibration and Normalization
Different sensor units have slight differences in sensitivity. The system is calibrated at the factory or before use to ensure that pressure values at each point are directly comparable. It also normalizes data based on weight, shoe size, and other factors to facilitate data comparison across different populations.
Pressure Distribution Reconstruction
The system maps the pressure values at each sensor point onto a two-dimensional surface on the sole of the foot, creating a color-coded pressure distribution map (high-pressure areas appear red, low-pressure areas appear blue or green), visually displaying the location and intensity of force.
Time series analysis
Not only should the pressure distribution at a single moment be examined, but also the changes throughout the gait cycle should be analyzed, such as the time of peak pressure, alternating support time between the two feet, and gait asymmetry.
IV. Key Scientific Indicators for Plantar Pressure Analysis
A plantar pressure distribution system is more than just a colorful chart; its core value lies in quantitative analysis. These indicators include:
Peak Pressure
This is used to assess the load on a specific area. For example, patients with diabetes are prone to ulcers at the metatarsal heads, and monitoring peak pressure can help prevent lesions.
Pressure-Time Integral
This reflects the total load on a specific area throughout the gait cycle and is useful for assessing the risk of chronic injuries.
Contact Area
Contact area is significantly increased in patients with collapsed arches or flat feet, while it is reduced in patients with high-arched feet.
Gait Phase Time Ratio
In normal gait, the ratio of stance phase to swing phase is approximately 60:40. Asymmetry may indicate locomotor system abnormalities or injury compensation.
Center of Pressure (COP) Trajectory
The COP trajectory reflects the path of center of gravity transfer. A healthy gait path is smooth and continuous, while patients with injuries or neurological disorders may experience deviations or irregular fluctuations.
V. The Value of Scientific Principles in Applications
Sports Injury Prevention
Analyzing plantar pressure can identify potential stress abnormalities in athletes and individuals, allowing for proactive adjustments to training methods and shoe design, thereby reducing the risk of plantar fasciitis, tibial stress fractures, and other conditions.
Rehabilitation Medicine
For patients undergoing stroke, amputation, or fracture surgery, plantar pressure monitoring allows physicians to assess whether rehabilitation training has improved gait symmetry and balance.
Shoe and Orthotic Design
The data can guide the design of insoles, functional shoes, or custom orthotics that better suit the foot's stress characteristics, reducing pressure in specific areas.
Clinical Disease Monitoring
Abnormal plantar pressure is an early sign of conditions such as diabetic foot and rheumatoid arthritis, and timely monitoring can prevent serious complications.
 Back to list
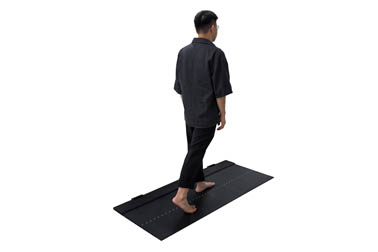


 +86-0755-86131192