
 +86-0755-86131192
 2025-09-22
The foot pressure distribution gait analysis system is a system that uses a high-precision sensor array to measure and analyze in real-time the pressure distribution, force changes, and dynamic characteristics of the foot during gait, walking, or running when in contact with the ground. This system is mainly used for gait health assessment, optimizing athletic performance, preventing injuries, designing personalized equipment, and for various applications in sports and rehabilitation treatment.
1. System Composition
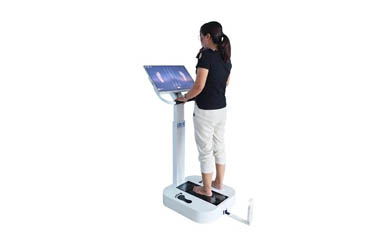
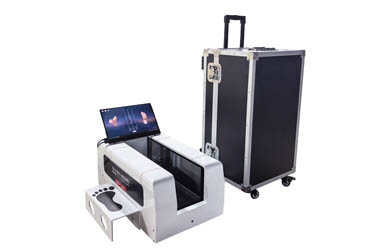
A typical foot pressure distribution gait analysis system consists of the following main components:
Pressure Sensor Array:
The sensors are the core of the system, typically using piezoelectric, resistive, or capacitive sensors. The sensors are arranged on a platform (or in insoles) and are capable of detecting the pressure changes when the foot comes in contact with the ground. The number of sensors commonly can range from several hundred to thousands, ensuring complete coverage of the entire foot area.Data Acquisition Unit:
This unit is used to capture sensor signals in real-time, sample and convert the data, turning analog signals into digital signals and transmitting them to a computer or processing unit via high-speed transmission.Signal Processing and Analysis Module:
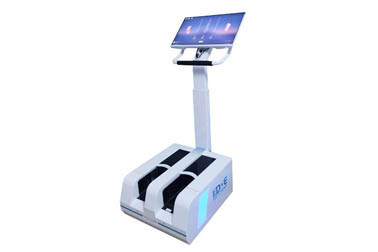
After data collection, the system amplifies, filters, normalizes, and processes the signals to extract pressure data, and then analyzes gait parameters. The analysis module typically uses specialized software for data processing and result analysis.Visualization Display and Reporting Module:
The system usually displays pressure distribution maps, dynamic curves of pressure changes over time (heatmaps, time-series graphs, etc.) to help users intuitively understand gait characteristics.
 2. Working Principle
Foot Pressure Collection:
During movement, different areas of the foot experience different amounts of pressure when each foot contacts the ground. The sensor array measures the pressure in these areas in real-time, generating a pressure data set over time and space.Pressure Data Processing:
The collected pressure signals are transmitted to a computer or analysis platform, where they are filtered, amplified, and processed to produce accurate pressure distribution maps and dynamic change data.Gait Analysis:
The system analyzes the collected data to extract gait cycle parameters (such as the ratio of swing phase to stance phase), step frequency, step length, step width, and other temporal and spatial parameters. It also combines foot pressure data to generate center of pressure (COP) trajectories.Result Display and Report Generation:
The system presents the results through a visual interface, displaying pressure distribution maps (usually in the form of heatmaps), gait curves, and other important gait-related parameters. The analysis results are then compiled into a report, helping users understand normal and abnormal gait states.
3. Main Application Areas
Medicine and Rehabilitation:
Gait Assessment: It can be used for gait analysis and health assessment of patients with foot diseases, joint problems, and neurological conditions (such as stroke, Parkinson's disease, etc.). By analyzing the pressure distribution in gait, doctors can assess whether the patient has gait abnormalities or needs treatment in certain areas.
Sports Injury Prevention: Regular foot pressure analysis for athletes can identify imbalanced or incorrect force distribution in gait, thus preventing long-term injuries caused by uneven load.
Rehabilitation Treatment: For patients with foot or lower limb injuries, foot pressure analysis can monitor rehabilitation progress and adjust the rehabilitation treatment plan.
Sports Performance Optimization:
Athletes can use foot pressure distribution analysis to optimize their gait during sports, improve running posture, jumping technique, etc., thereby enhancing athletic performance.
In sports such as basketball, soccer, and running, foot pressure analysis can optimize foot landing techniques, reduce energy consumption, and lower joint pressure, improving exercise efficiency.
Footwear and Sports Equipment Design:
Foot pressure analysis can provide data support for the design of sports shoes and insoles, creating more comfortable and professional equipment based on different sports types and athletes' foot pressure characteristics.
Sports shoe manufacturers can design shoes with better cushioning, support, and comfort based on users' foot pressure data.
Elderly Health Management:
For the elderly population, gait changes are a common manifestation of aging. Foot pressure analysis can help detect gait changes early, assess fall risks, and provide targeted interventions to improve elderly people's quality of life and mobility.
Scientific Research and Data Accumulation:
Foot pressure analysis systems are widely used in biomechanics, kinesiology, and other research fields. By accumulating large amounts of data, researchers can explore the effects of different gaits and movement patterns on foot pressure, providing a theoretical foundation for sports medicine, footwear design, and other fields.
4. Key Features and Advantages
High Precision: High-density sensor arrays can provide detailed and accurate foot pressure distribution maps, capturing subtle changes during the gait process.
Real-Time Analysis: The system can capture and process data in real-time, adapting to fast-moving gaits, particularly suitable for dynamic activities such as running and jumping.
Personalized Data: Based on an individual’s foot pressure data, personalized training, rehabilitation, and sports equipment plans can be designed.
Intuitive Visualization: Pressure distribution and gait characteristics are visually presented through heatmaps, curve graphs, etc., making it easier for users to understand and apply the data.
 Back to list
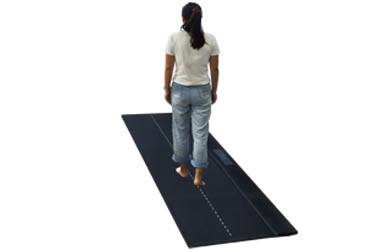


 +86-0755-86131192